Turn raw data into dashboards worth sharing
Connect your data, model relationships and measures, and design interactive dashboards — or fork one the community already built and make it yours.
Every question has a shape
Twenty-two visuals, and the only one that matters is the one that answers what you asked. Pick a question.
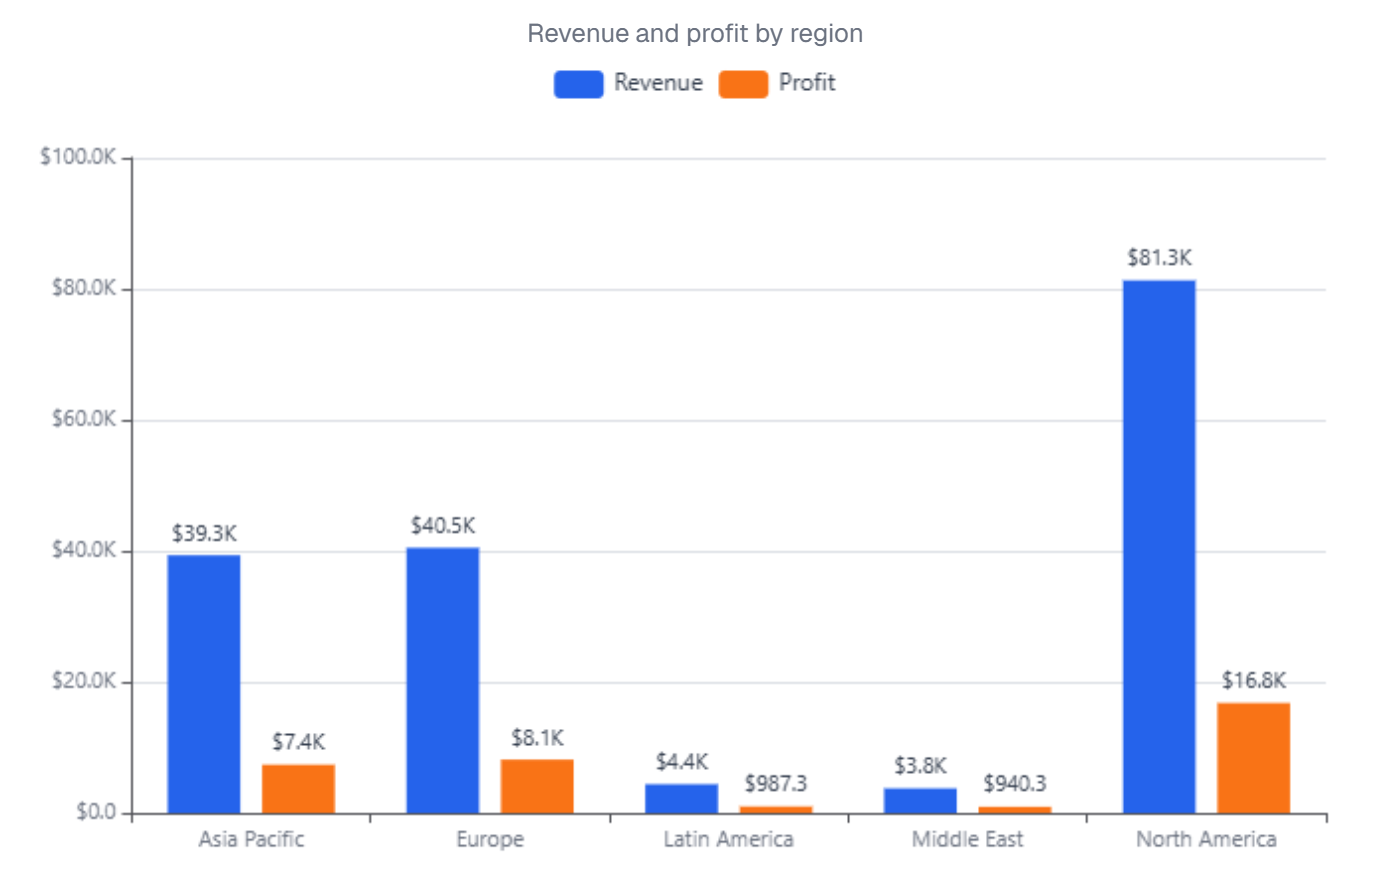
Compare any measure across categories side by side, then click a bar to cross-filter the rest of the page.
Four steps from messy data to a decision
One workspace for all of it — no stitching five tools together to answer one question.
Point it at your data and stop
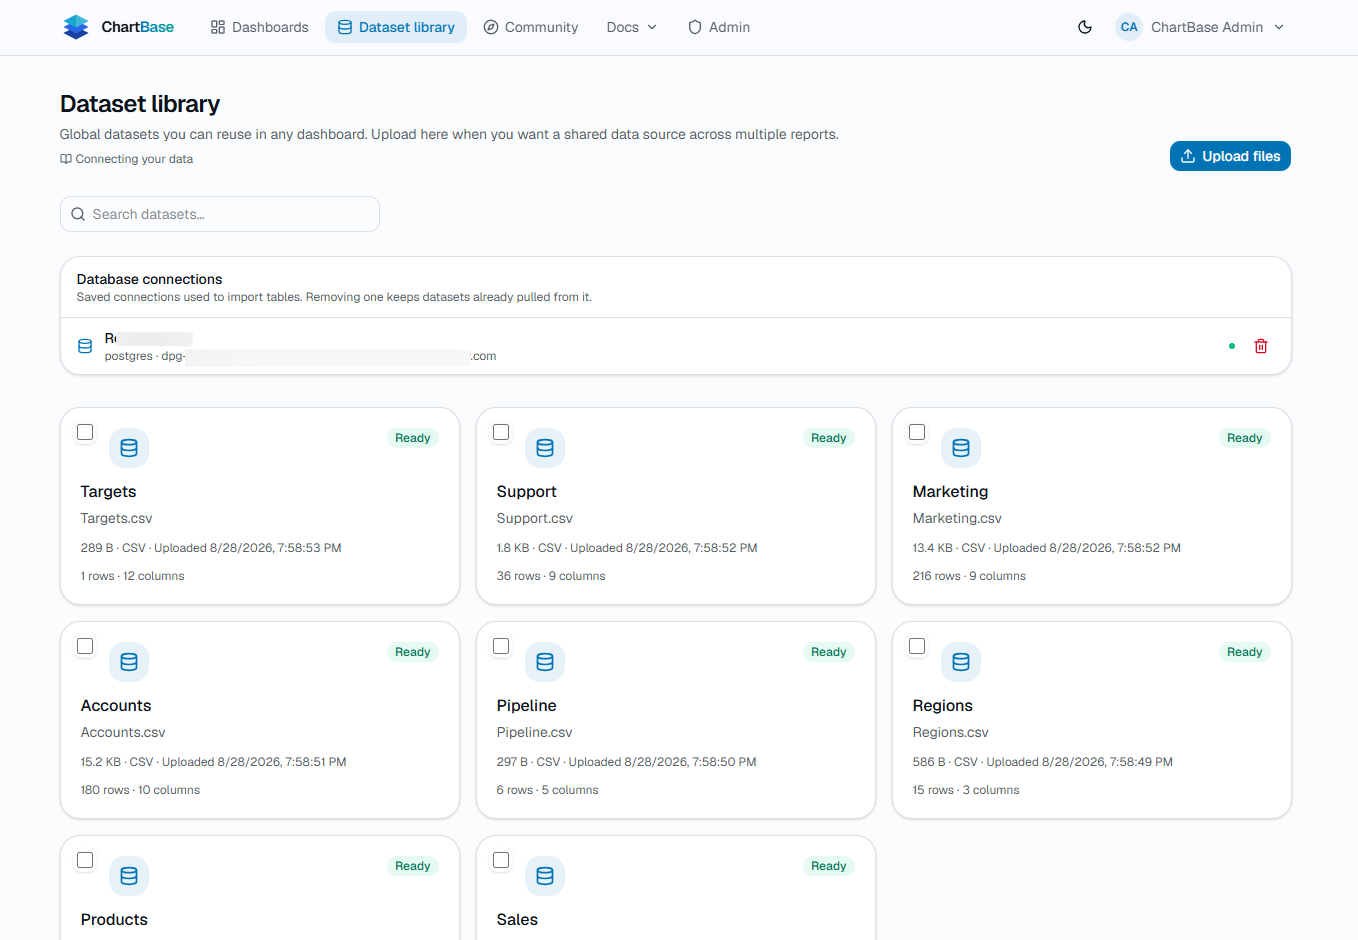
Drop in a CSV or Excel file, or connect PostgreSQL or MySQL — including Supabase, Neon, RDS and anything else speaking those protocols. Column types are detected on the way in, and everything lands in a columnar engine that keeps millions of rows sub-second.
Specifics, not adjectives
Every line here links to the documentation that proves it.
Common questions
The things people ask before signing up.
What is ChartBase?
ChartBase is a browser-based analytics workspace. You bring in data from a spreadsheet or a database, describe how your tables relate to each other, then build interactive dashboards on top of that model and share them as a link, an embed, or a PDF. There is nothing to install.
What data can I connect?
CSV and Excel (.xlsx) files by upload, and PostgreSQL or MySQL databases by direct connection. A workbook with several worksheets imports as one dataset per sheet. Database connections can be refreshed on a schedule, so a dashboard keeps up with the source without anyone re-uploading anything.
Is there a free plan?
Yes, and it does not expire. The Free plan covers 5 dashboards, 5 datasets, one database connection and 100 MB of storage, with no card required. Pro and Team both start with a free trial — the current length is shown on each plan at checkout.
Do I pay for people who only need to look at a dashboard?
No. Viewers are free and unlimited on every plan. You only pay for editors — the people who build and change dashboards. That is deliberate: a dashboard nobody can read is not worth building, so reading is never the thing we charge for.
How is my data kept secure?
Database credentials are encrypted with AES-256-GCM and are only ever used to read — a read-only account is enough for everything ChartBase does. Dashboards are private until you share them, and on the Team plan you can add row-level security so two people opening the same dashboard see only the rows their group is allowed.
Bring your data into one workspace
However it reaches you — a spreadsheet, a production database, or someone else's dashboard — it ends up in the same place, ready to chart.
Typed on import
Dates, numbers, text — told apart
Upload a file
CSV and Excel. Columns are typed as they come in, so a date behaves like a date before you chart it.
Encrypted credentials
Read-only access is enough
Connect a database
PostgreSQL and MySQL. Point at a table or paste a query — credentials are encrypted, and a read-only user is all we need.
Fork it
A dashboard that already works
Fork from the community
Start from a dashboard someone already published, then point it at your own data and make it yours.